– Help Version 1.4
Table of contents - click a subject below to be taken to that section
Overview
System
requirements
Installation
Getting
ready
Starting
the program – configuration
Use
on consumer level DSL/Cable modems
Configuring
device network address - optional proxy server
Change
the Device Name
Set the device
query interval
Configure
Probes
Set
the Probe Type
Set
the Display Units
Set
the Alarm Limits on Each Probe
Configure
your email settings
Applying
to all probes or independent probe settings
Customizing
Alarm/Caution/Clear status email messages
Email
Body Template
Setting
alarm sounds
The
Main Window
Arranging the
probe status info in the main window
Probe
Status Displays
Program
Configuration
Starting the
program minimized
Data
and Logs
Log File Handling
The Chart Window
Probe Names in
Chart Legends
Chart Color
Configuration
Network/Power
outages and false alarm prevention
Voice
dialer feature
External
program launch on alarm condition
Technical
Support
TempElert Spectrum (hereafter TES) is an enterprise level temperature, humidity, wetness, and switch status monitoring program for use in mission critical type applications where you may need to monitor multiple locations across a LAN, Intranet, WAN, VPN, or public Internet systems. Each location utilizes a wired or wireless network enabled environmental monitoring device that reports conditions via TCP/IP networking HTTP protocol. This enables the utilization of consumer level networking solutions such as Cable, DSL, and 3G/4G cellular networking for remote locations off your main network.
TES is
designed to allow maximum flexibility and configurability, allowing
the user to simultaneously monitor environmental conditions at one or
hundreds of locations simultaneously, and to initiate alerts out-of-bound conditions via email, pagers, cell phones, and voice direct
dial (with optional hardware), plus audible and visual status alerts.
TES is designed to be configurable so that an operator or safety officer can configure the display to be “at a glance” status, choosing colors, styles, and orientations that best suit the monitoring needs.
A PC using 32 or 64 bit versions of XP, Vista, and Windows 7 operating systems.
A network port on that PC connected to LAN, Intranet, WAN, VPN, or public Internet systems
One or more remote environmental monitor devices each configured with one or more probes
Ability for the PC running TES to “see” the remote environmental monitor device via the network
An email account capable of SMTP/POP3 email sending
Optionally:
For voice dialing, an RS-232 serial port configured as COM1 up to COM8 and the optional TES voice dialer hardware (see www.tempelert.com for details)
For audible alerts, speakers connected to the PC
For cellphone/pager alerts – a mobile device capable of receiving email via SMTP
Insert the CD ROM into the drive and wait for the auto-start to run. If it does not, you may have to manually browse the drive and to locate the TES setup program. Note that there are two program folders, one for 32 bit Windows and another for 64 bit Windows. Please use the appropriate one for your operating system.
During installation, you'll be asked to provide your serial number to continue. This serial number is registered to you at the time of purchase.
Once installed, the TES program will appear in the start menu and on your desktop as an icon like this:
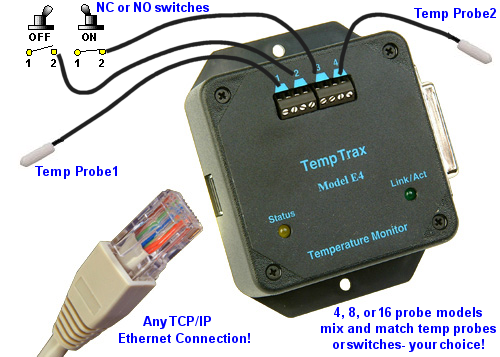
You'll need to provide one or more TempTrax temperature or environmental monitors (with one or more probes and/or switch inputs) on your LAN, WAN, or located somewhere on the public internet that is reachable by domain name or IP address. In a company setting, you would typically place one or more of these devices on a fixed IP address within your network and then use that address in the TES program for the location of the device.
A TempTrax model E4 is shown below. Refer to the operation manual for the Model E4 on how to set it up for an IP address.
Starting the program – configuration
1. Double click on the icon to start the program. After the splash screen disappears, you'll get a basic screen that shows no entries in the “Device List” tab.
2. You must add a device and configure the probes attached to it. Do this by clicking on:
![]()
3.
This will bring up the configuration dialog as shown below.
You should type in the IP address or domain name for the device where indicated. This might take the form of (for example) 192.168.0.101 for a LAN or devicename.mycompany.com if your network administrator has made a DNS entry for it.
The checkboxes for logging are enabled by default. If you have limited disk space, be aware that new logs will be written every 24 hours, and the disk may eventually fill up since there is no automatic deletion of logs. Uncheck the boxes if you do not need logging.
Use on consumer level DSL/Cable modems
Note that if you are installing one or more of these devices remotely, such as on a DSL line, be sure to ask for a fixed IP address when setting up the service. Otherwise, IP addresses may rotate/change. You may be able to use a service like DynDNS http://www.dyndns.com/ to provide a way to remotely track devices on consumer grade internet connection like DSL or Cable modems. In this case, you might get a domain name assigned such as temptrax1.dyndns.org using their free service at http://www.dyndns.com/services/dns/dyndns/
Be sure that port 80 (standard HTTP) port is open (it normally is) for incoming traffic through any routers or firewalls. If need be, you can assign a different port number for reaching the device, just be sure the port numbers stored in the device and in TES match.
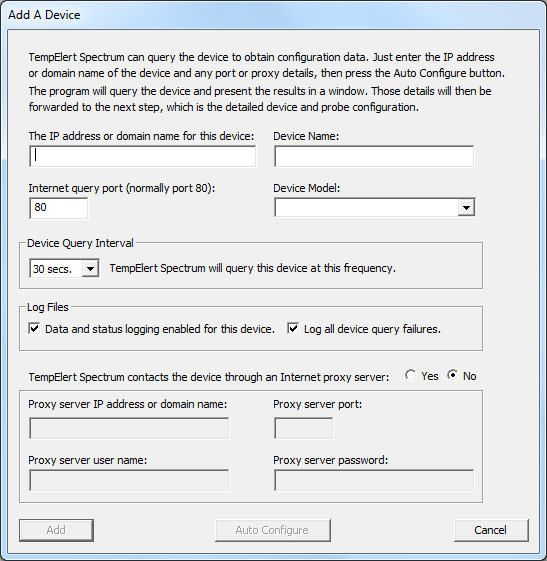
Configuring device network address - optional proxy server
Normally you'd simply enter an IP address or domain name for the device. However, some company networks make use of a proxy server, and you may need to configure for this. Check with your network administrator for settings if you use a proxy server and enter them in the dialog as shown below:
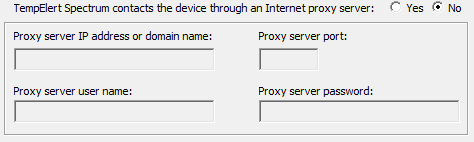
The default setting is “No” to not use a proxy server.
Once you have your network location established and typed in, you can then use the AutoConfigure Button to speed the configuration process. Here's a summary of how that works.
You can enter the IP address or fully qualified domain name (FQDN) (do not include the protocol specifier "http://") for any supported device and after pressing the button, TES will present a summary of the device's firmware settings.
![]()
If you enter a device name before querying the device for autoconfigure, then the entered device name takes precedence and will be used instead of the device name configured in the device's firmware.
The TempTrax device will be given a default name, such as “Etemp”. To make this relevant to your use, you may wish to change this to something like “Server Room1” or “Cold Storage Unit A”. This name will be used in subsequent displays and alert messages sent by email, so it is important to know where the alert is coming from if you have multiple locations to monitor.
If you
press the OK button in the confirmation dialog, those values are
added to the probe configuration pages and all probes will be set to
default values. You can then manually tweak each probe setting
afterwards.
If you
press Cancel in the confirmation dialog you are returned to the Add
Device dialog.
If you enter all of the necessary values in the Add Dialog manually, then press the Add button, you will be presented with a probe configuration dialog matching the selected device type, with default values.
If you used the “Auto Configure” button, all probes will be set to default values and alarm thresholds. Each probe will be named Probe1, Probe2...Probe X etc. These should be changed to reflect what you are monitoring. See the dialog below for sample probe settings.
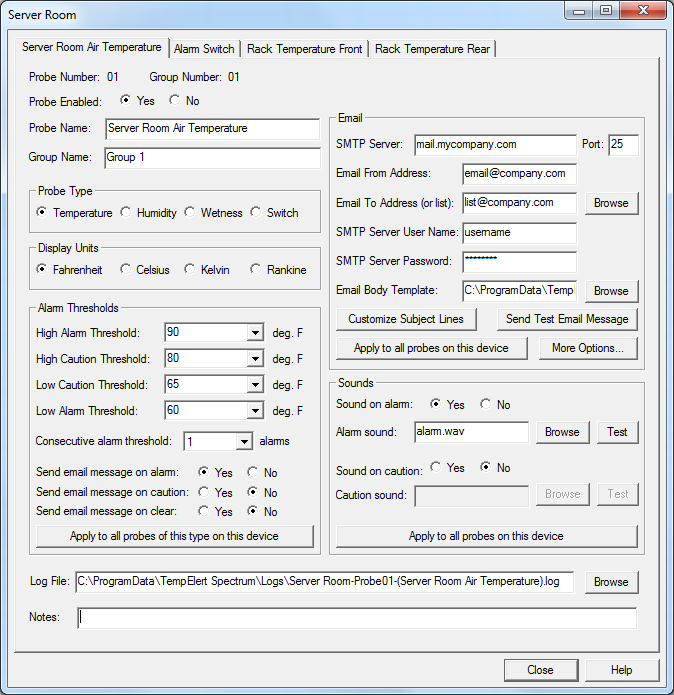
After setting the values, press the “Close” button to save the probe values. Details on individual sections follow.
Choose one of these. Make sure the probe type matched the channel number on the device.
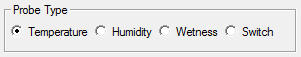
For switches, this can be normally opened or normally closed, which you can configure later.
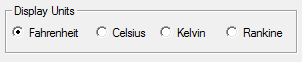
Supported temperature scales are:
Fahrenheit
Celsius
Kelvin
Rankine
Display units are probe-centric and values will be converted to the selected unit scale if necessary.
The TempTrax models EM and U devices report their display units. If you select a display unit designation other than what the device has reported, you will be asked to confirm your selection. The TempTrax model E devices only support Fahrenheit units and all values will be converted if any scale other than Fahrenheit is selected.
Set the Alarm Limits on Each Probe
The Temperature alarm limits allow the user to select any pre-loaded integral value (those values are pre-set to the device's minimum and maximum range). You may also elect to type a non-integer number with a single-digit mantissa.
For example 79.5 but not 79.55
A pull-down menu allows you to choose or you can type in numbers directly. Use the Tab key to move between fields.
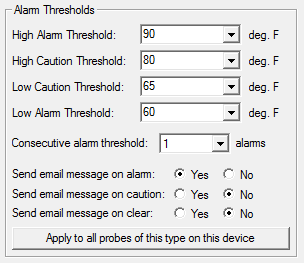
Choose what type of alerts you want for each probe. You can have email/pager alerts sent on full alarms, cautions, or on event cleared situations.
Note that you can set the number of alarm threshold events required to rise to an alerting action using the “Consecutive alarm threshold” selector. The default is 1 event. However, if you have a situation where you may get brief transients out-of-bounds, but they do not rise to the level of an alert, you can set the value higher. For example, if you set it to 5, it will take 5 consecutive events before an email alerting condition is met.
Note that if you have identical or duplicate backup probes installed, you can easily set thresholds for all probes with a single click of this button:
![]()
Even after doing that, you can easily make changes to each probe's threshold settings using the tabbed interface, but this is often the easiest way of getting everything setup first.
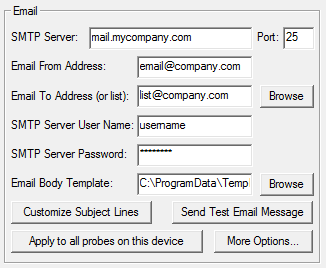
To use
this feature, you need will access to an SMTP server. This can be your
company email server, or an external mail service. All you need is
the web address of the server, and a username/password for
authentication of your email account. See the example entries above.
Once you
have entered your email server and account details, you can send a
test email to ensure it is working correctly using this button:
![]()
A
test email will then be sent (assuming you've correctly configured
everything) to the “Email to Address” or list you have
chosen.
There are two ways to send to a list of email recipients:
Use a list server feature on your mail server, where you send to something like list@company.com
Create a text file using a plain text editor like notepad.exe in the form of comma, seimicolon, or line delimited format. For example:
name1@company.com,name2@company.com,nameX@company.com
or
name1@company.com
name2@company.com
namex@company.com
Applying
to all probes or independent probe settings
If
you have identical probes and the emails coming from them should
follow the same reporting format, once you have set up the first
probe on the device, simply click the:
![]()
to
apply email settings to all probes. Otherwise, use the tabbed
interface to individually configure each probe.
Customizing
Alarm/Caution/Clear status email messages
There are many customization options available for messages. Note that by design, TES generates small short email messages since many of them may be directed to the small screens of cellphones or pagers with a limited number of displayable characters.
For
alarm and caution conditions, the program generates the email body
from a user-customizable text template.
The default template is named DefaultEmailTemplate.txt and resides in the program's Templates folder (a sub-directory of the applications common data folder).
A
variety of character string replacement tags are available to
customize email templates.
For alarm clear events, the email body is hard-coded:
---
An alarm condition has been cleared by the device named $DEVICE_NAME
on the probe named $PROBE_NAME (probe number $PROBE_NUMBER ).
The alarm was cleared on $ALARM_DATE at $ALARM_TIME.
---
For switch type probes, both the alarm and alarm clear messages are hard-coded:
Alarm events:
---
A switch alarm has been reported by the device named $DEVICE_NAME
on the probe named $PROBE_NAME (probe number $PROBE_NUMBER).
The alarm occurred on $ALARM_DATE at $ALARM_TIME.
---
Clear events:
---
A switch alarm has been cleared by the device named $DEVICE_NAME
on the probe named $PROBE_NAME (probe number $PROBE_NUMBER).
The alarm was cleared on $ALARM_DATE at $ALARM_TIME.
---
In all cases, the email subject lines are configurable using the Customize Subject Lines button which brings up this dialog:
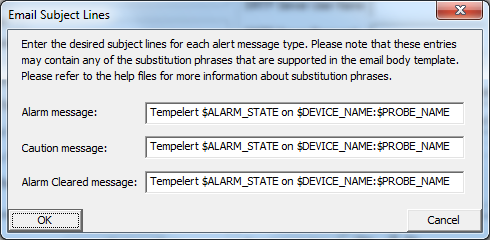
It is not required that you edit these, you can simply leave the defaults in place if you choose.
The user may elect to use a template file for email messages. This is a selectable template file which can be accessed via this button and browse feature:
![]()
Should
you wish to make edits, it is recommended that you make a copy of the
original template first, then use notepad.exe or a similar plain-text
editor to make changes per the list of tags below.
The
following tags in the template will be replaced with program values:
$CURRENT_VALUE (the value reported by the probe)
$ALARM_STATE (the current alarm state, i.e. High Alarm, Low Caution Alarm, etc.)
$ALARM_DATE (date the alarm occurred)
$ALARM_TIME (time the alarm occurred)
$THRESH_EXCEEDED (what was exceeded or met to generate the alarm or clear)
$PROBE_NAME (probe name)
$DEVICE_NAME (device name)
$PROBE_NUMBER (probe number)
$GROUP_NAME (group name)
$CONSECUTIVE_COUNT (number of consecutive alarm conditions)
$CONSECUTIVE_THRESH (threshold setting for consecutive alarms)
The default template supplied with the program is:
===
TempElert has detected a $ALARM_STATE condition
on $DEVICE_NAME:$PROBE_NAME (probe #$PROBE_NUMBER).
The alarm occurred on $ALARM_DATE at $ALARM_TIME.
The probe is reporting a value of $CURRENT_VALUE, and
that exceeds the threshold of $THRESH_EXCEEDED for this
alarm condition.
The probe is a member of the group named $GROUP_NAME.
The probe has reported this state for $CONSECUTIVE_COUNT
queries, and TempElert has been configured to send an
alert message if the alarm condition persists for more
than $CONSECUTIVE_THRESH consecutive queries.
===
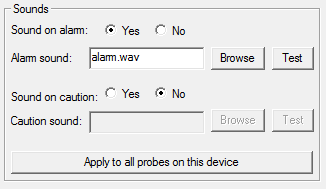
Each
probe can have a specific alarm sound using a WAV audio file from the
local hard disk. In this way you can have an audio alert that says
something like “Server Room Probe 1 has an alert condition!”
or “Freezer number 6 reports over temperature!” or beeps,
sirens, or klaxon sounds if you prefer.
It is
easy to record your own WAV files using the Windows Sound Recorder,
and then place them into the TES data folder.
A small
collection of WAV files is provided with the TES installation. You
can see them by pressing the “Browse” button.
When the "Device List" tab is selected, you'll see a list of all devices and all probes. It is designed to give you a tabular "at a glance" list of all probes on all devices without have to read the data on each. The row colors show the status, and if any probe on any device becomes out of bounds, you'll immediately see a color change.
This provides for an easy instant "green across the board" check of all devices and all probes.
The main window can be re-sized. It will optionally remember its size between invocations of the program. The rows of data can also be easily sorted and configured to your preference.
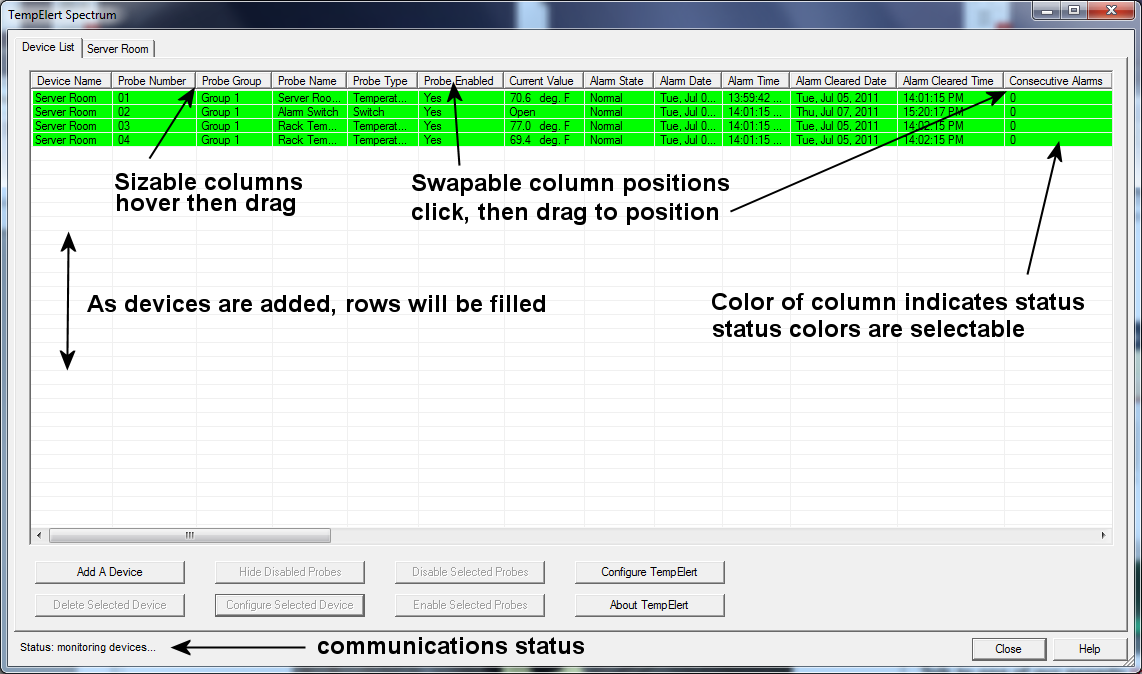
The device/probe list can be sorted by any column. Left-click on a column header to sort the by that column value in ascending order. Shift-left-click on a column header to sort the by that column value in descending order. The program will not currently remember the sort order between invocations of the program.
Any column may be hidden or restored by right-clicking on the column header and selecting the column from the menu. Columns with a check mark are visible. The program will remember what columns are hidden between invocations of the program.
Column order can be changed with a left-click-and-drag of the column header tab.
The program will remember the column order between invocations of the program.
Column size can be changed with a left-click-and-drag of the separator between column headers.
Arranging the probe status info in the main window
You can arrange what pieces of probe status information you want in the main window by right clicking on any of the probe status info bars at the top. A checkbox dialog will be displayed as shown below
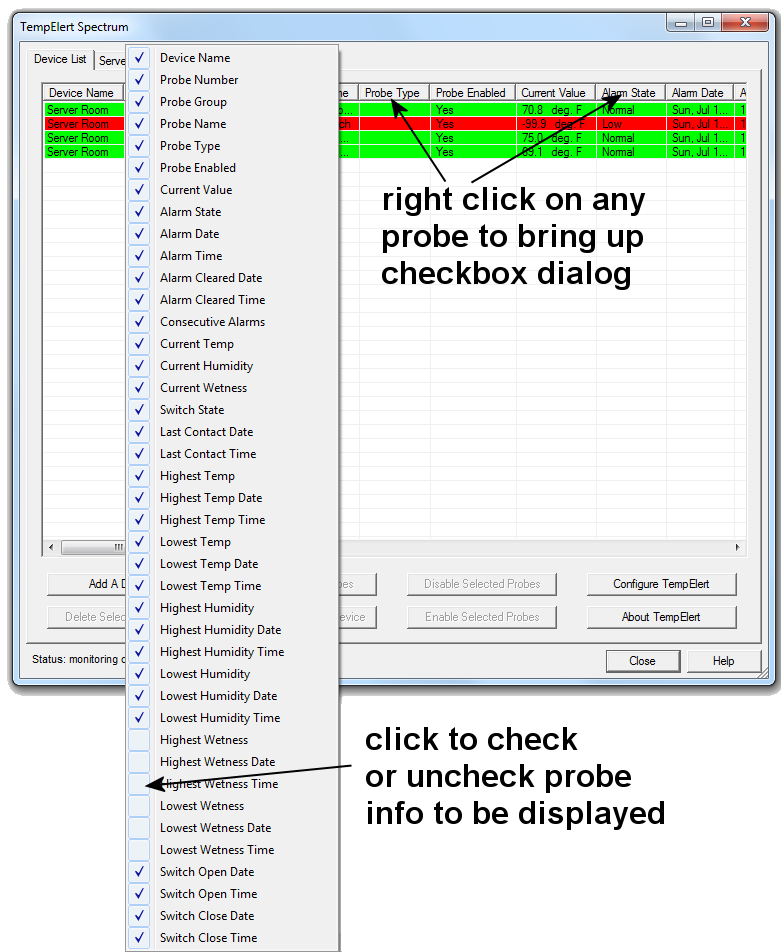
Using the checkboxes, display what info you would like displayed by toggling the check symbol with a left mouse click.
These are secondary floating windows that give a thermometer, hygrometer, or switch scale plus a visual status annunciator. They are patterned after the process control meters found in industrial process control rooms around the world.
Double-click on any probe in the main window list to bring up a probe status window.
The ranges, values, and status icon are dynamic and based on current settings and reported values.
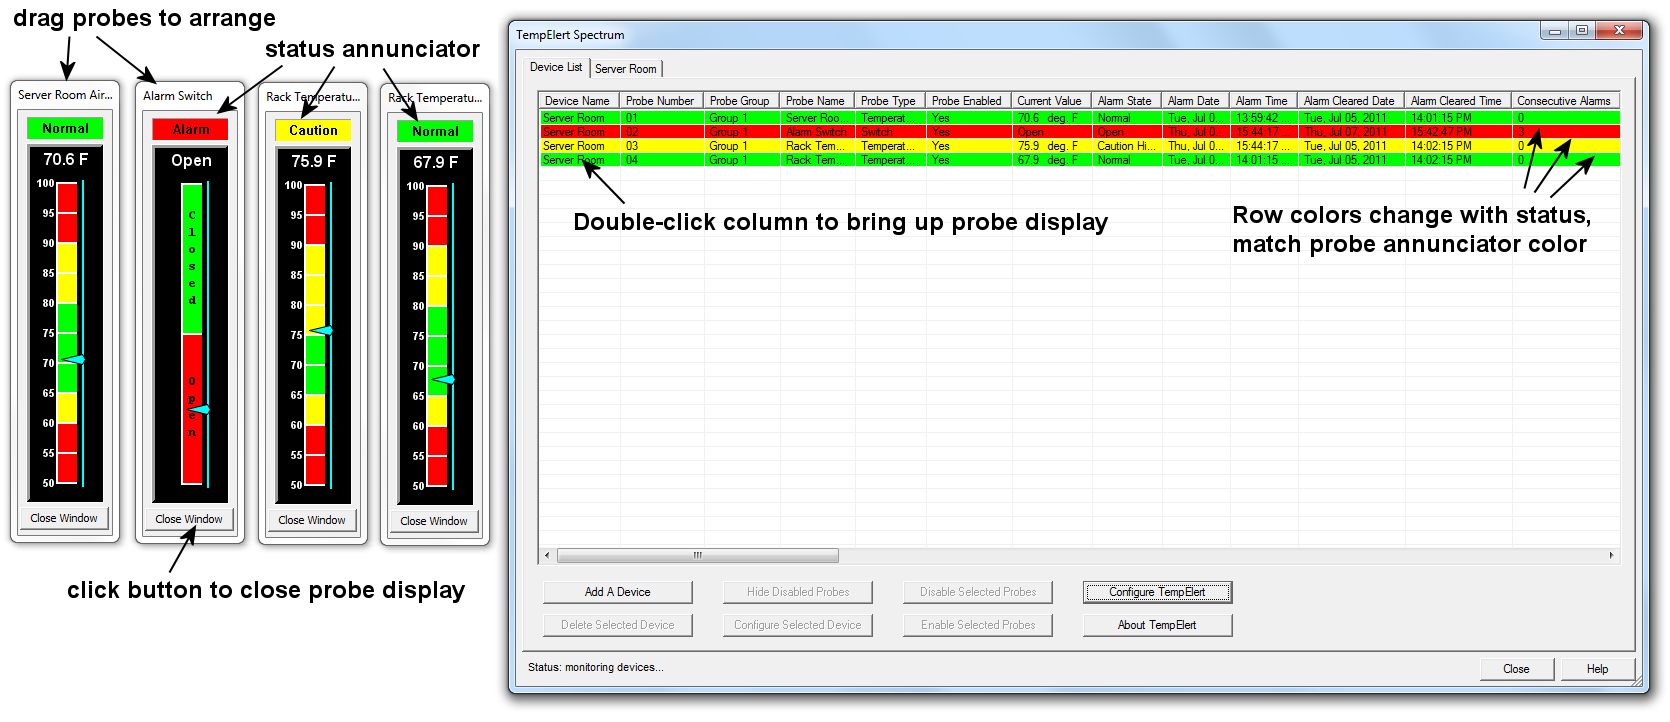
You can have as many probe status windows on display as you have device probes and that will fit on your desktop real estate. They can be positioned anywhere on the screen.
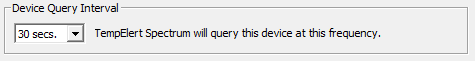
The status of each probe status window is updated on every device query. Devices are queried every 30 seconds. The graphs and logs for each probe will be updated at the frequency the user selected in the probe configuration screens.
This dialog is invoked by pressing the "Configure TempElert" button on the main window. It allows you to choose the colors and range for the the two tab selectable screens of the Main Window.
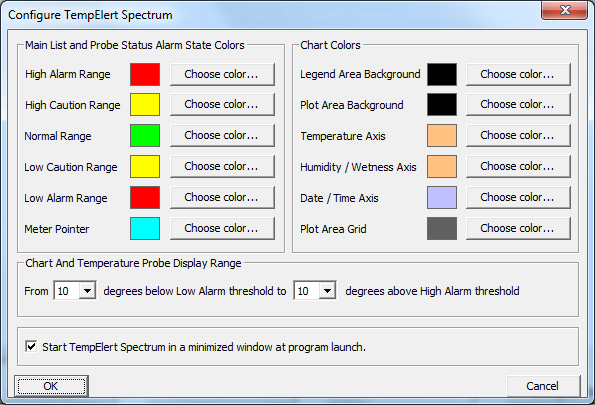
The user may select the colors that represent each of the alarm status conditions as displayed in the rows
The user may select the overhead range for temperature probe status displays.
The overhead range is the number of degrees above or below the high and low alarm limits that are displayed on the thermometer control, affording the user a display that shows the ranges more clearly than if the thermometer's upper and lower limits were constrained to the high and low alarm limits.
Starting the program minimized
Usage in a shortcut (such as in the startup folder) for
example might be:
"C:\Program Files\TempElert
Spectrum\TempElert Spectrum.exe" -minimize
TES will run fully functional while minimized, and will deliver email and any other types of alerts you have configured.
Probe data is logged in <AppCommonDataPath>\TempElert\Data
The location is selectable from the probe configuration dialog:
![]()
Probe status and alarm information is logged in <AppCommonDataPath>\TempElert\Logs
The format of the data log file name is:
"<Device Name>-Probe<nn>-(<Probe Name>).csv"
where
<Device
Name> is the given device name and <nn> is the probe number
(01-16), and <Probe Name> is the currently configured probe
name.
The format of each line of data in the log is "mm-dd-yy,hh:mm:ss,nn.n" where
mm is the month (01-12)
dd is the day of the month (01-31)
yy is the year (00-99)
nn.n is the value reported by the probe
Probe data is archived every 24 hours at midnight. All of the .csv files for today's activity is moved to a directory that is named with the date in mm-dd-yy format.
The status logs are in human-readable form (free-form text) and contain significant events such as program initialization and alarm events, as well as configuration events that affect the probe data such as enabling/disabling the probe or changing its monitor frequency or type.
You can invoke the chart/graph display by choosing the tab at the top of the main TES window. Note that the name of this tab will change based on what you named the monitoring device in the device configuration. Additional tabs will appear with the appropriate names as you add devices.
A typical chart windows looks like this:
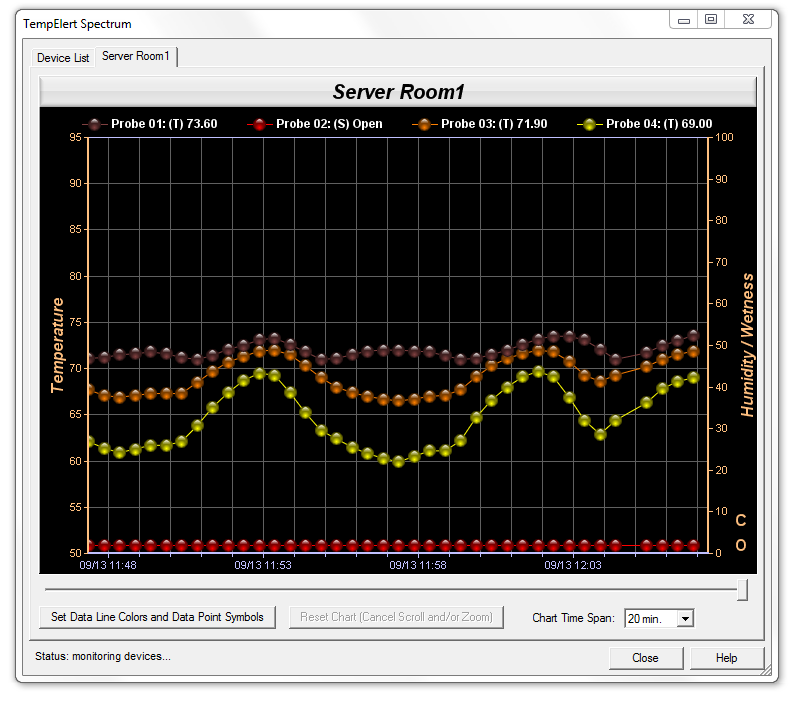
Note how the switch status for probe #2 at the bottom has a C and O on the right axis, showing the status for Closed and Open. Here are the control features:
The chart time span may be set at 5,10, 20, 30 minutes, 1 hour, 24 hours, 7 days, or 30 days using the drop down dialog box on the lower right. The 7 and 30 day chart ranges are available only if the query interval for the specified device is greater than or equal to 30 seconds. Otherwise there is too much data to plot and display for those time ranges.
If the user selects a 24-hour span, the data points are represented on a line without data point symbols for clarity. Otherwise, the data is represented using the selected data point symbol.
The chart may be scrolled by using the slider control below the chart.
The user can zoom in on the chart data by dragging a box around the selected data or by simply left-clicking on a point in the chart.
Zoomed data can be scrolled, and scrolled data can be zoomed.
If the chart is zoomed and/or scrolled, the real-time chart data is suspended.
The data is still being collected, it just isn't displayed on the zoomed or scrolled chart to prevent the view from jumping around when new data is collected.
When the chart is reset (by clicking the reset button), the newest data is displayed.
The user can reset the chart to default zoom and scroll positions (which also resumes the real-time chart updates) by pressing the Reset Chart button or by right-clicking in the chart's plot area.
Disabled probes are displayed in grey in the chart legend and data for those probes is not charted. For enabled probes, an infotip appears when the user hovers the mouse over the legend entry. The infotip describes the probe name and value.
The user can cause any data set to be brought in front of the others in the chart display by clicking on the data set's legend entry.
The number of data points is determined by the chart time span selection and zoom level.
If the number of data points is less than or equal to the number of pixels in the width of the plot area the chart displays the data points with symbols and allows the user to view a tooltip at each data point that displays the date/time and value at that data point.
When the
number of data points exceeds the number of pixels in the width of
the plot area, the data is plotted using a single line. This improves
performance at high data density levels. The plot line width for that
chart mode is configurable in the color and symbol selection dialog.
Charts can be saved to an image file in BMP, PNG, JPG, or GIF format in any specified location in any specified file name.
Press CTRL-S to invoke the Save As dialog.
In addition, when a chart is printed, the user is prompted to save the chart to a file.
By default, chart files are saved in PNG format in <program common data folder>\Save, and the file names are "device_name start_date-time to end_date-time".
Chart symbols and colors for all data lines can be selected by clicking the “Set Data Line Colors and Data Point Symbols” button, which will bring up this dialog:
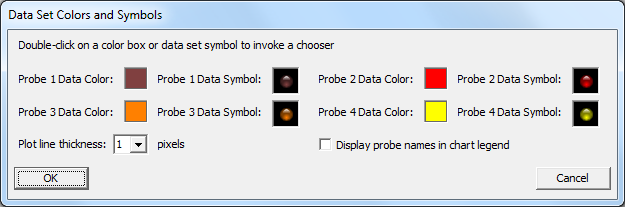
Double-click
on any of the small images to invoke the appropriate chooser dialog for colors
and symbols. You can then choose any color, or any of the many symbols available
for each probe.
You can also choose to have no symbols for data points, and a pure line plot only. If you wish to have the descriptive probe names shown at the top of the chart, check the Display probe names in chart legend.
Line plotting width on the graph is also selectable.
This dialog is available for each device you are monitoring.
Network/Power outages and false alarm prevention
For mission critical applications, it is strongly recommended that you do these three things:
Run TES on a dedicated computer that does not have any casual user interaction (such as web browsing) that may cause interruption of the TES program
Run that computer on an uninterruptible power supply (UPS)
Not use a proxy server (it could fail, preventing communications when you need it most)
These three importantant preventative measures will help to ensure that TES is able to do the job you need it to do.
Network communication anomalies are expected to occur and can result in false alarm alert messages being generated. In addition, alarm thresholds can be set such that occasional, acceptable transient alarm conditions occur.
To compensate for transient conditions, the user can set a per-probe threshold for consecutive alarm condition measurements. If the device reports an alarm condition for more than the threshold number of queries, an alert message is generated, as well as any ancillary alert functions such as sound, voice dialer trigger, and external program launch.
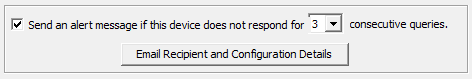
More general network failures can be detected as well. On a per-device basis, the user can select the number of consecutive query failures. The program's response to that event is separate from the probe alarm condition responses and email is generated for a recipient list specific to that failure event. Note that this is tied to the setting of the device query interval, such that if the query interval is set to one minute, then three consecutive failures will take three minutes to complete.
The email subject line and body text are configurable in the device configuration dialog and all of the text replacement variables available for alarm messages apply.
An additional replacement string named "$QUERY_THRESH" is available for displaying the consecutive query failure threshold.
The default email subject line for this message is
TempElert Query Failure
and the default body is
The device named $DEVICE_NAME has not responded for $QUERY_THRESH minutes.
(optional hardware required as shown below, see www.tempelert.com for details)
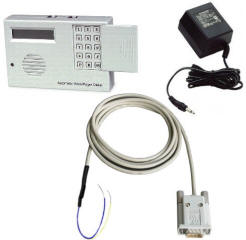
The user enables the external voice dialer hardware and selects a serial (COM1, COM2...COMx) port on a per-device basis. The configuration details and test functions are in the voice dialer configuration dialog shown below.
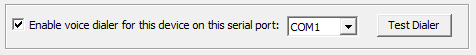
Pressing the “Test Dialer” button will send a signal out the selected COM port and cause the voice dialer to deliver messages per how it is programmed.
The user configures the trigger for the dialer on a per-probe basis by pressing the More Options button in the probe configuration dialog. The dialer must be programmed to deliver voice messages from its hardware panel. See the manual for the voice dialer to record and configure voice messages, and a list of telephone numbers to dial.
One voice dialer can be assigned to each device, and TES will support however many dialers are connected to serial ports on your monitoring PC.
External program launch on alarm condition
For each alarm or clear condition, the user may elect to have the program run any Windows program.
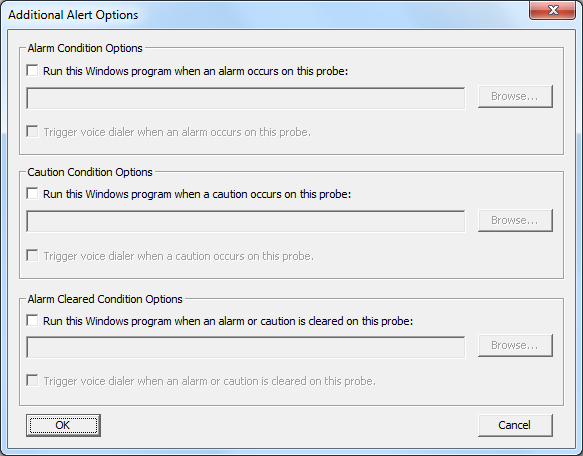
The program name and any optional arguments are specified by pressing the More Options button in the probe configuration dialog. As with any command line, any argument containing spaces (text or paths, etc.) must be enclosed in quotes.
Technical support is offered via web page, email, and telephone.
email to info@it-techworks.com
or call 530-899-8434 9AM-5PM PST Weekdays